Calculations On Regeneration
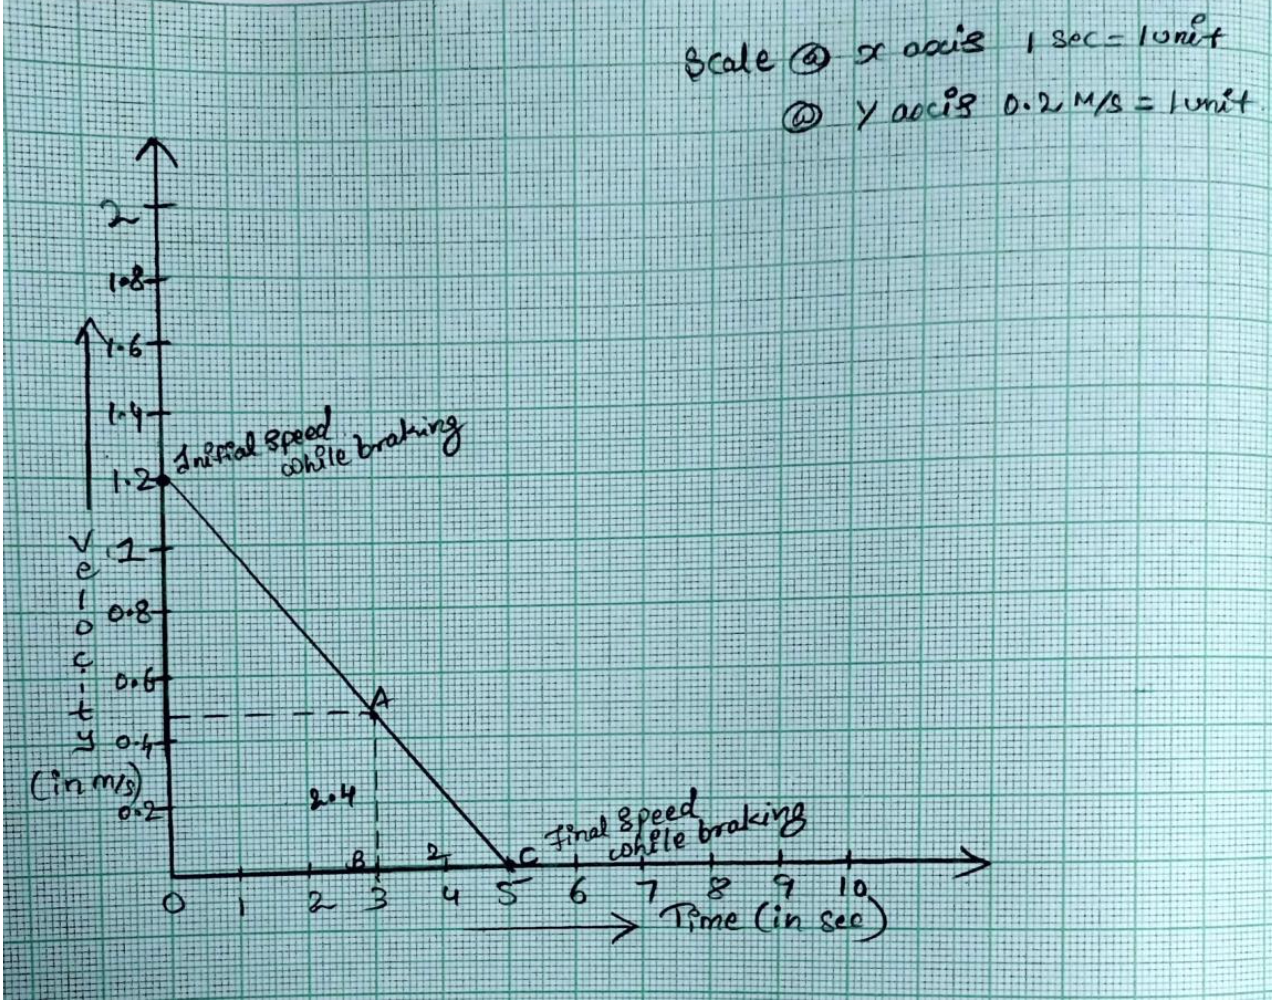
Velocity VS time graph during normal braking regen stage-1
The above graph shows the variation of speed with respect to the time, when their is an ammount of external force acting on a brake pedal during Normal braking as practically it take time of 5 seconds to stop during normal braking and generates less regeneration voltage comparitively by the calculation we got around 5 V during normal braking
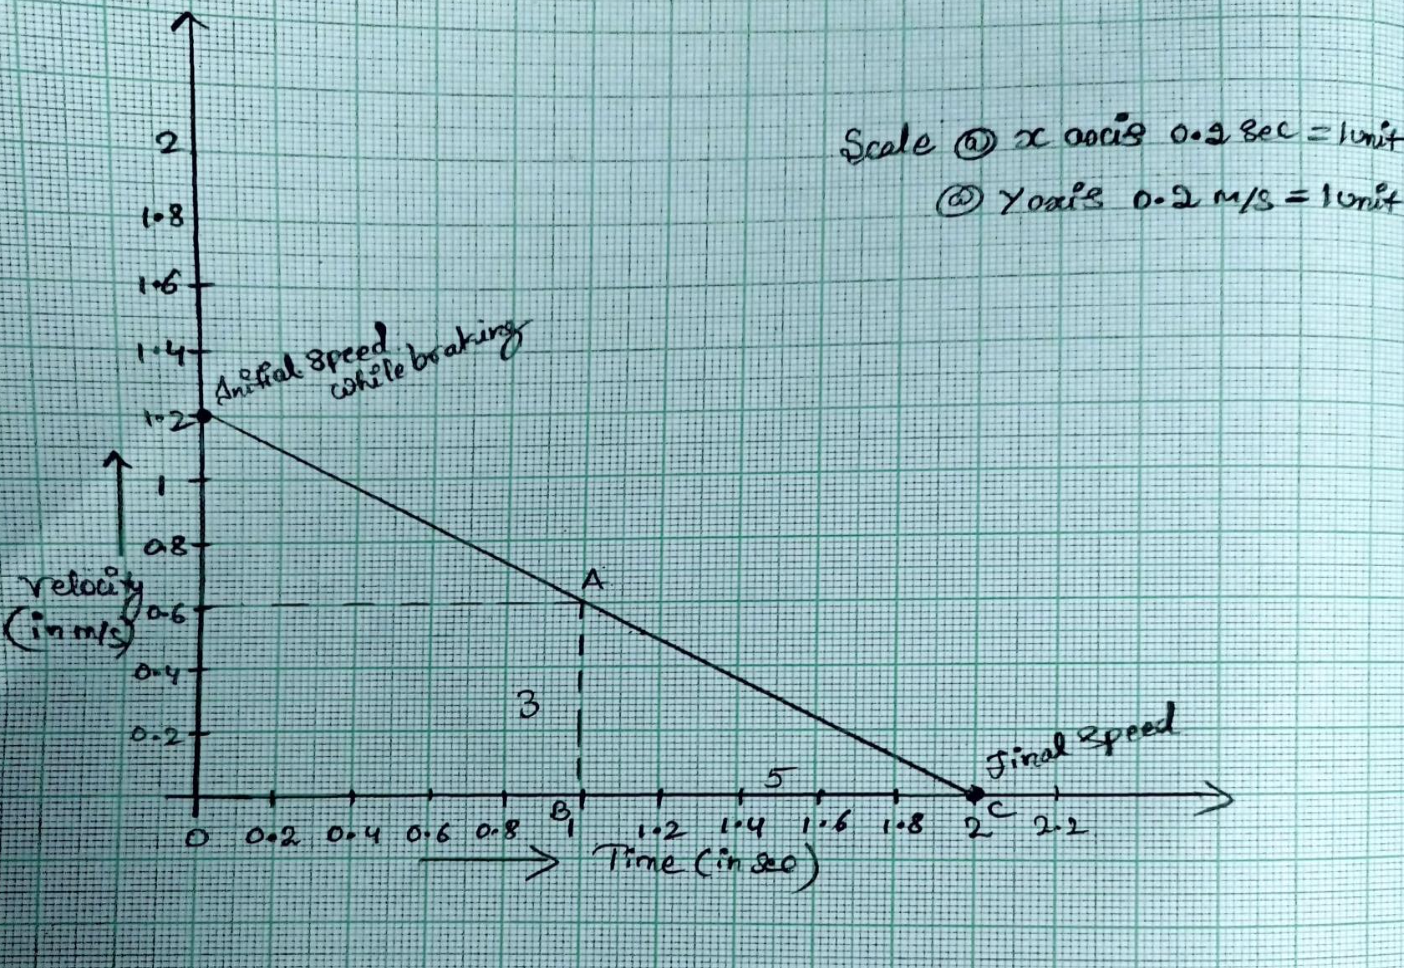
Velocity VS time graph during Heavy braking regen stage-2
The above graph shows the variation of speed with respect to the time, when their is an ammount of external force acting on a brake pedal during Heavy braking as practically it take time of 2 seconds to stop during heavy braking and generates more regeneration voltage comparitively by the calculation we got around 12.5 V during Heavy braking